
Published 17 hours ago
In the weekly time frame chart, the Ethereum price shows a bullish breakout from a famous chart pattern called the symmetrical triangle pattern. Under the influence of this pattern coin prices usually narrow within two converging trendlines and offer a significant direction rally upon the breakout of the trendlines. Thus, today we will look for the same chart pattern in fellow altcoins and determine the potential growth as they follow one of the market leaders.
advertisement
Binance Coin(BNB)

Source- Tradingview
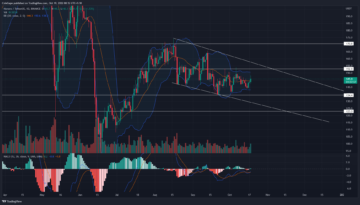
For over a year, the Binance coin price resonated between two converging trendlines showing the formation of a symmetrical triangle pattern. Traders have been actively responding to the pattern setup as evidenced by the coin price bouncing off the support trendline twice and the resistance trendline three times.
By the press, the BNB price trades at $322 and rechallenges the resistance trendline of the chart pattern. If the weekly candle breach above the downsloping trendline the buyers will obtain significant support to lead the coin price higher.
Trending Stories
In a favorable bullish scenario, the BNB price could rally 80% to reach the $6000 mark.
Chainlink (LINK)

Source- Tradingview
Over the past eleven months, the chainlink coin price has wobbled within two horizontal levels $9.4 and $5.4, indicating an evident sideways trend. However, within this consolidation phase, the coin price narrowing within two converging trendlines indicates the formation of a symmetrical triangle.
As for now, the LINK price trades at $7.756 and retests the overhead resistance trendline of the chart pattern. A potential breakout from the aforementioned trendline with a weekly candle closing above offers an early sign of trend reversal.
This breakout could assist buyers to escape this consolidation phase and chase the $12 high.
Also Read: Top Crypto Copy Trading Platforms For 2023
Uniswap (UNI)

Source- Tradingview
In the weekly time frame chart, the UNI/USD pair shows a simple structure of a symmetrical triangle pattern where the prices are getting squeezed with two converging trendlines. With the recent growth in the crypto market, the coin price has recently rebounded from the support trendline indicating a bull cycle with the chart pattern.
Currently, the UNI price trades at $6.3, and with sustained buyers, the price will rise 10% to challenge the overhead trendline. If the buyers manage to pierce the resistance trendline, the accelerated buying pressure would drive the coin 88% higher to hit the $13 mark.
Share this article on:
advertisement
The presented content may include the personal opinion of the author and is subject to market condition. Do your market research before investing in cryptocurrencies. The author or the publication does not hold any responsibility for your personal financial loss.
<!– Close Story–>
- SEO Powered Content & PR Distribution. Get Amplified Today.
- Platoblockchain. Web3 Metaverse Intelligence. Knowledge Amplified. Access Here.
- Minting the Future w Adryenn Ashley. Access Here.
- Source: https://coingape.com/markets/3-cryptocurrencies-showing-same-bullish-patterns-as-ethereum/
- :is
- 1
- 10
- 7
- 8
- 9
- a
- above
- accelerated
- actively
- Ad
- Altcoins
- and
- ARE
- article
- AS
- assist
- At
- author
- avatar
- banner
- Beauty
- before
- between
- blockchain
- bnb
- BNB Price
- breach
- breakout
- Brian
- bull
- Bullish
- buyers
- Buying
- by
- called
- challenge
- Chart
- chase
- closing
- Coin
- Coingape
- COM
- condition
- consolidation
- content
- converging
- copy trading
- could
- crypto
- crypto copy trading
- Crypto Market
- cryptocurrencies
- cryptocurrency
- cycle
- Determine
- different
- direction
- drive
- Early
- eleven
- Entertainment
- Ether (ETH)
- ethereum
- famous
- Fashion
- fellow
- finance
- financial
- follow
- For
- formation
- FRAME
- from
- getting
- Growth
- Have
- High
- higher
- Hit
- hold
- Horizontal
- HOURS
- However
- HTTPS
- i
- in
- include
- Including
- indicates
- indicating
- influence
- influencer
- investing
- journalism
- jpg
- Last
- lead
- leaders
- levels
- LINK
- link price
- Look
- loss
- manage
- mark
- Market
- market research
- May..
- months
- obtain
- of
- offer
- Offers
- on
- ONE
- Opinion
- past
- Pattern
- patterns
- personal
- phase
- Platforms
- plato
- Plato Data Intelligence
- PlatoData
- plugin
- potential
- presented
- press
- pressure
- price
- Prices
- Publication
- rally
- reach
- Read
- recent
- recently
- research
- Resistance
- responding
- responsibility
- Reversal
- Rise
- same
- scenario
- setup
- Share
- Shows
- sideways
- sign
- significant
- Simple
- structure
- subject
- support
- Symmetrical Triangle
- The
- The Weekly
- three
- time
- times
- to
- today
- Topics
- Traders
- trades
- Trading
- Trading Platforms
- TradingView
- Trend
- trending
- Twice
- under
- UNI
- UNI/USD
- usually
- variety
- weekly
- will
- with
- within
- working
- would
- written
- year
- years
- Your
- zephyrnet