Bitcoin Cash price is holding the key $205 support against the US Dollar. BCH could start a fresh increase if it stays above the $205 and $200 support levels.
- Bitcoin cash price started a fresh decline below the $230 level against the US Dollar.
- The price is trading below $220 and the 100 simple moving average (4 hours).
- There is a key bearish trend line forming with resistance near $217 on the 4-hour chart of the BCH/USD pair (data feed from Kraken).
- The pair could start a fresh increase unless there is a move below $200.
Bitcoin Cash Price Holds Support
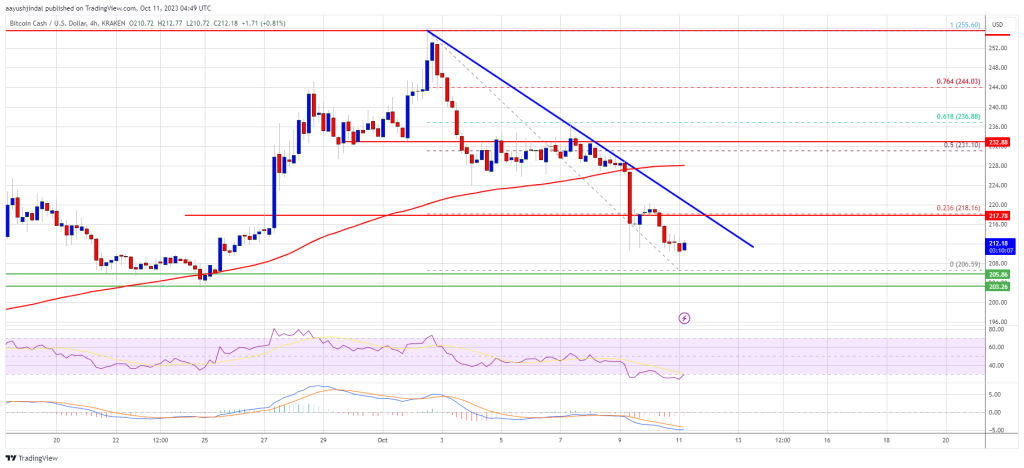
In the past few days, Bitcoin Cash price saw a steady decline from the $255 resistance zone. BCH declined below the $232 support to enter a short-term bearish zone, like Bitcoin and Ethereum.
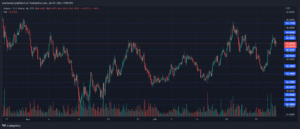
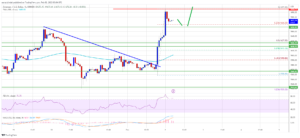
The bears were able to push the price below the $220 support. Finally, the price found support near the $205 zone (a multi-touch zone). A low has formed near $206.59 and the price is now consolidating losses. It seems like there is a key bearish trend line forming with resistance near $217 on the 4-hour chart of the BCH/USD pair.
Bitcoin Cash is now trading below $220 and the 100 simple moving average (4 hours). Immediate resistance is near the $217 level and the trend line. It is close to the 23.6% Fib retracement level of the downward move from the $255 swing high to the $206 low.

Source: BCH/USD on TradingView.com
The next major resistance is near $228 or the 100 simple moving average (4 hours). The next major resistance is near the $232 level. It is close to the 50% Fib retracement level of the downward move from the $255 swing high to the $206 low. Any further gains could lead the price toward the $250 resistance zone.
Downside Break in BCH?
If Bitcoin Cash price fails to clear the $217 resistance, it could continue to move down. Initial support on the downside is near the $205 level.
The next major support is near the $200 level, where the bulls are likely to appear. If the price fails to stay above the $200 support, the price could test the $184 support. Any further losses could lead the price toward the $162 zone in the near term.
Technical indicators
4-hour MACD – The MACD for BCH/USD is losing pace in the bearish zone.
4-hour RSI (Relative Strength Index) – The RSI is currently below the 50 level.
Key Support Levels – $205 and $200.
Key Resistance Levels – $217 and $232.
- SEO Powered Content & PR Distribution. Get Amplified Today.
- PlatoData.Network Vertical Generative Ai. Empower Yourself. Access Here.
- PlatoAiStream. Web3 Intelligence. Knowledge Amplified. Access Here.
- PlatoESG. Carbon, CleanTech, Energy, Environment, Solar, Waste Management. Access Here.
- PlatoHealth. Biotech and Clinical Trials Intelligence. Access Here.
- Source: https://www.newsbtc.com/analysis/bch/bitcoin-cash-price-prediction-205-support/
- :has
- :is
- :where
- 1
- 100
- 23
- 50
- a
- Able
- above
- against
- and
- any
- appear
- ARE
- average
- BCH
- BCH/USD
- bearish
- Bears
- below
- Bitcoin
- Bitcoin Cash
- Break
- Bulls
- Cash
- Chart
- clear
- Close
- consolidating
- continue
- could
- Currently
- data
- Days
- Decline
- Dollar
- down
- downside
- downward
- Enter
- fails
- few
- Finally
- For
- formed
- found
- fresh
- fresh increase
- from
- further
- Gains
- High
- holding
- holds
- HOURS
- HTTPS
- if
- immediate
- in
- Increase
- index
- initial
- IT
- Key
- Kraken
- lead
- Level
- levels
- like
- likely
- Line
- losing
- losses
- Low
- MACD
- major
- max-width
- move
- moving
- moving average
- Near
- NewsBTC
- next
- now
- of
- on
- or
- Pace
- pair
- past
- plato
- Plato Data Intelligence
- PlatoData
- prediction
- price
- Price Prediction
- Push
- rally
- relative
- relative strength index
- Resistance
- retracement
- rsi
- saw
- seems
- short-term
- Simple
- start
- started
- stay
- strength
- support
- support levels
- Swing
- term
- test
- The
- There.
- this
- to
- toward
- Trading
- TradingView
- Trend
- trigger
- us
- US Dollar
- were
- with
- zephyrnet