Bitcoin price activity suggests the currency is headed for a major move in the next few days. Over the last month, Bitcoin has fluctuated in the $30,000-$35,000 range and even plummeted to $29,000 at one point as it struggled for stability around a support level. Although investors were upbeat about its brief surge beyond $35k a few days ago, the digital asset’s overall price action, which continues to trend below the 20-day moving average(MA), shows a lack of optimism.
Indicators and Price Action Reveal Bitcoin is Due for a Big Move
Various technical indicators are pointing to an imminent move in either direction for Bitcoin. The Bollinger Bands indicator that helps predict major upheavals in the market is the most significant among them. Currently, this indicator is at its tightest level since December 2020.
Nearing the end of 2020, Bitcoin soared above $20,000 and set a new all-time high(ATH) after three years. Since then, the primary cryptocurrency gained over 200% in value within a period of four months, till it almost reached its present ATH of $65,000.
As per data from TradingView, the distance between the top and bottom Bollinger bands is closing at the moment. The tighter the bands become, the more likely it is for the market to witness a big price move.
Another indicator that is useful for projecting future BTC prices is a decline in the trading volumes in July. Data reveals that the last weekend accounted for the lowest trading volumes in 2021 so far. Usually, an asset’s price could move in either direction when trade volumes are descending.
Apart from the technical analysis, another factor that could hit Bitcoin’s price activity in the next few days is Grayscale’s BTC unlocking. The leading Bitcoin fund will unlock over 16,000 BTC, which could trigger a potential sell-off. But it’s not unusual for the market to react contrary to expectations in such cases, which makes it difficult to predict the impact of this unlocking.
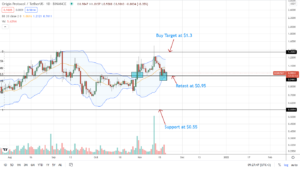
Bitcoin Outstanding Resistance and Support Levels
Going forward, Bitcoin’s first key resistance level is at $34,000, given the long-term descending trend line and the 20-day MA. After this point, the currency’s resistance lies at $35,600 provided the 50-day MA, $36,620, which indicates the late June high, and $39,500, as per the early June high.
As for support levels, the first point is $33,500, which is followed by $32,700, $31,500, $31,185, $30,600, $30,000.
Charts highlight that the daily relative strength index(RSI) is mostly beneath the midline and unable to surpass the long-term descending trend line, thus stopping the higher highs on the RSI from February onwards.
Source: https://www.cryptoknowmics.com/news/bitcoin-price-action-suggests-big-move-in-upcoming-days
- "
- 000
- 2020
- 2021
- Action
- active
- among
- analysis
- around
- ATH
- Bitcoin
- Bitcoin Price
- bitcoin-fund
- border
- BTC
- cases
- Cause
- continues
- cryptocurrency
- Cryptoknowmics
- Currency
- data
- digital
- distance
- Early
- First
- Forward
- fund
- future
- High
- Highlight
- HTTPS
- Impact
- Investors
- IT
- July
- Key
- leading
- Level
- Line
- major
- Market
- months
- move
- Optimism
- Posts
- present
- price
- rally
- range
- React
- set
- So
- Stability
- support
- support level
- surge
- Technical
- Technical Analysis
- top
- trade
- Trading
- value
- weekend
- within
- years