Bitcoin Price Prediction – July 8
The Bitcoin price is fluctuating at the $32,500 level and traders have so far been bearish as global markets remain deep for the past few days.
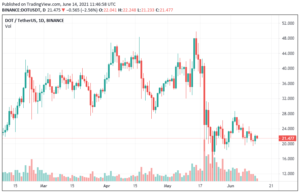
BTC/USD Long-term Trend: Bearish (Daily Chart)
Key levels:
Resistance Levels: $39,000, $41,000, $43,000
Support Levels: $28,000, $26,000, $24,000

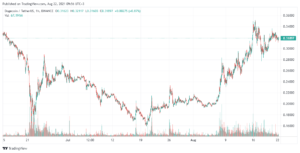
BTC/USD continues to fall as the first digital asset slides from the opening price of $33,897 to trade around the $32,615 level at the time of writing. However, the Bitcoin price is now hovering below the 9-day and 21-day moving averages. The Bitcoin price crashes below the immediate support as it breached a $33,000 price area. Taking a glance at the price movement now, we could see that the coin had almost a flat movement with a few intermittent highs and lows over the past few days.
Bitcoin Price Prediction: BTC Price May Drop More
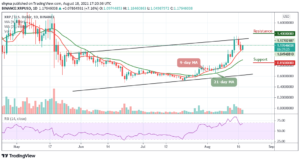
According to the daily chart, the Bitcoin price is forming a bearish movement and it is still under great risk of breakdown especially if the pattern support is shattered. With today’s drop, all eyes now rest on the support at $31,500, where BTC double-bottomed in the last month of June and was able to reclaim over $36,000 shortly after. Moreover, it could be catastrophic for the Bitcoin (BTC) if support at $32,000 gives in, which could encourage more selling, forcing the Bitcoin price down a painful path with a bearish target of $30,500.
However, BTC/USD is strongly supported at the former resistance level of $32,500. Meanwhile, it is necessary for the coin to stay around the moving averages so that bulls could rely on the supports at $28,000, $26,000, and $24,000. On the contrary, the potential resistance levels are located at $39,000, $41,000, and $43,000 if the price crosses above the upper boundary of the channel. Meanwhile, the Relative Strength Index (14) is likely to cross below 40-level to increase the bearish movement.
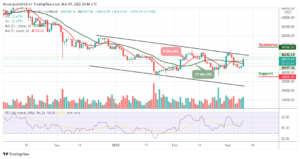
BTC/USD Medium – Term Trend: Bearish (4H Chart)
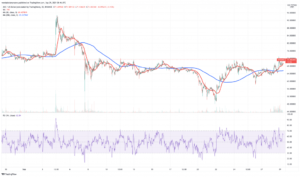
On the 4-Hour chart, the Bitcoin price is hovering around $32,777 and as the 9-day MA crosses below the 21-day MA, the king coin may take time to persistently trade above $35,000. Therefore, if the bulls put all the pressure together and push the price up, the upward movement may reach the resistance level at $34,000 and above.

On the downside, the immediate support is located around the $32,000 level. A further bearish movement could test the critical support at the $31,700 level and below. Technically, the technical indicator Relative Strength Index (14) faces the north, aiming to cross above 40-level.
Looking to buy or trade Bitcoin (BTC) now? Invest at eToro!
75% of retail investor accounts lose money when trading CFDs with this provider
Source: https://insidebitcoins.com/news/bitcoin-price-prediction-btc-usd-risk-plunges-to-30000
- 000
- Aiming
- All
- AREA
- around
- asset
- bearish
- Bitcoin
- Bitcoin Price
- Bitcoin price prediction
- BTC
- btc price
- BTC/USD
- Bulls
- buy
- Coin
- continues
- digital
- Digital Asset
- Drop
- faces
- First
- Global
- great
- HTTPS
- Increase
- index
- investor
- IT
- July
- King
- Level
- Markets
- medium
- money
- North
- Pattern
- prediction
- pressure
- price
- Price Prediction
- REST
- retail
- Risk
- So
- stay
- support
- Supported
- Supports
- Target
- Technical
- test
- time
- trade
- Traders
- Trading
- writing