Bitcoin price is struggling below the $26,500 resistance. BTC could accelerate lower if there is a close below the $26,000 support in the near term.
- Bitcoin is struggling and trading well below the $27,500 resistance.
- The price is trading below $26,500 and the 100 hourly Simple moving average.
- There is a key bearish trend line forming with resistance near $26,420 on the hourly chart of the BTC/USD pair (data feed from Kraken).
- The pair could resume its decline unless there is a close above the $26,500 level.
Bitcoin Price Faces Hurdles
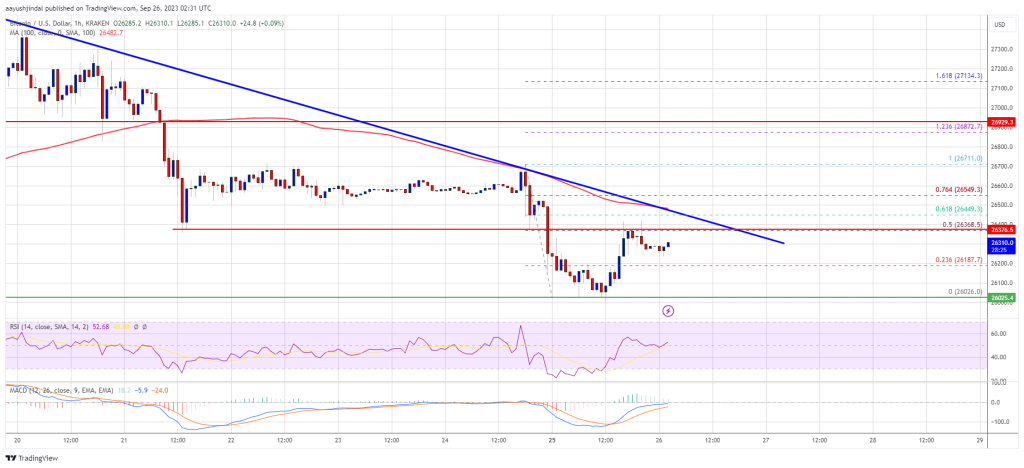
Bitcoin price started a fresh decline below the $26,800 level. BTC traded below the $26,500 and $26,200 support levels to move into a negative zone.
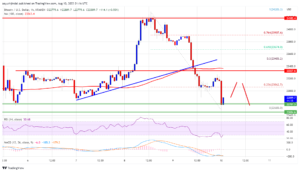
Finally, the pair tested $26,000 and a low was formed near $26,026. Recently, the price started a minor recovery wave above the $26,200 level. The price climbed above the 23.6% Fib retracement level of the recent drop from the $26,712 swing high to the $26,026 low.
However, the bears are protecting a break above the $26,500 resistance. The price is struggling to clear the 50% Fib retracement level of the recent drop from the $26,712 swing high to the $26,026 low.
Bitcoin is now trading below $26,500 and the 100 hourly Simple moving average. Immediate resistance on the upside is near the $26,400 level. There is also a key bearish trend line forming with resistance near $26,420 on the hourly chart of the BTC/USD pair.

Source: BTCUSD on TradingView.com
The next key resistance could be near the $26,500 level, above which the price could gain bullish momentum. In the stated case, the price could climb toward the $27,000 resistance. Any more gains might call for a move toward the $27,500 level.
More Losses In BTC?
If Bitcoin fails to start a fresh increase above the $26,500 resistance, it could continue to move down. Immediate support on the downside is near the $26,150 level.
The next major support is near the $26,000 level. A downside break and close below the $26,000 level might start another major decline maybe toward the next support at $25,400. Any more losses might call for a test of $25,000.
Technical indicators:
Hourly MACD – The MACD is now losing pace in the bearish zone.
Hourly RSI (Relative Strength Index) – The RSI for BTC/USD is now below the 50 level.
Major Support Levels – $26,150, followed by $26,000.
Major Resistance Levels – $26,400, $26,500, and $27,000.
- SEO Powered Content & PR Distribution. Get Amplified Today.
- PlatoData.Network Vertical Generative Ai. Empower Yourself. Access Here.
- PlatoAiStream. Web3 Intelligence. Knowledge Amplified. Access Here.
- PlatoESG. Carbon, CleanTech, Energy, Environment, Solar, Waste Management. Access Here.
- PlatoHealth. Biotech and Clinical Trials Intelligence. Access Here.
- Source: https://www.newsbtc.com/analysis/btc/bitcoin-price-turns-vulnerable-26500/
- :is
- 000
- 1
- 100
- 150
- 200
- 23
- 400
- 420
- 50
- 500
- a
- above
- accelerate
- also
- and
- Another
- any
- ARE
- AS
- At
- average
- BE
- bearish
- Bears
- below
- Bitcoin
- Bitcoin Price
- Break
- BTC
- BTC/USD
- Bullish
- by
- call
- case
- Chart
- clear
- climb
- Climbed
- Close
- continue
- could
- data
- Decline
- down
- downside
- Drop
- faces
- fails
- followed
- For
- formed
- fresh
- fresh increase
- from
- Gain
- Gains
- High
- HTTPS
- if
- immediate
- in
- Increase
- index
- Indicators
- into
- IT
- ITS
- Key
- key resistance
- Kraken
- Level
- levels
- Line
- losing
- losses
- Low
- lower
- MACD
- major
- max-width
- maybe
- might
- minor
- Momentum
- more
- move
- moving
- moving average
- Near
- negative
- NewsBTC
- next
- now
- of
- on
- Pace
- pair
- plato
- Plato Data Intelligence
- PlatoData
- Point
- price
- protecting
- recent
- recently
- recovery
- relative
- relative strength index
- Resistance
- resume
- retracement
- rsi
- Simple
- start
- started
- stated
- strength
- Struggling
- support
- support levels
- Swing
- term
- test
- tested
- The
- There.
- to
- toward
- traded
- Trading
- TradingView
- Trend
- turns
- Upside
- Vulnerable
- was
- Wave
- weakness
- WELL
- which
- with
- zephyrnet