TL; DR Breakdown
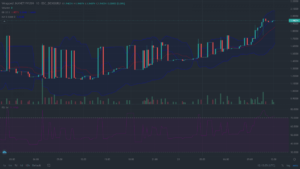
- The 24-hour chart on the ATOM/USD pair shows that price action is bullish.
- The ATOM/USD price ranged between $25.4-$27.0 on the daily Cosmos price analysis chart.
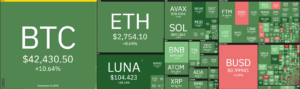
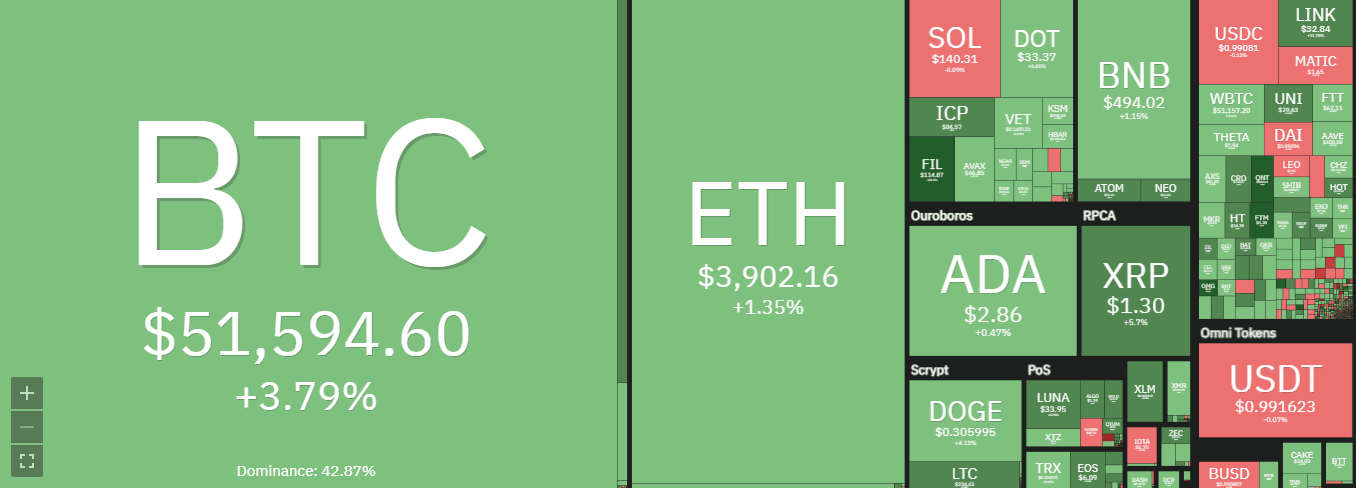
- The majority of the cryptocurrency heat map is in green, signifying a bull market.
Cosmos price analysis: General price overview
Cosmos has been trading in bullish momentum in the past week, recording a three percent price surge. 5-day Cosmos price analysis chart shows that the green candlesticks have outnumbered the red ones, meaning bulls control most Cosmos trading sessions.
The daily Cosmos price analysis chart shows that price action is bullish. As a result, ATOM/USD prices are expected to rise in the following 24 hours. Currently, Cosmos is trading at $26.2, a 6 percent increment from yesterday’s price.
Cosmos is unable to break through the Exponential Moving Average. The daily Cosmos price analysis chart shows that the token is trading at $26.2. ATOM/USD was advancing in bullish momentum in the early trading hours, resulting in head and shoulder formations. However, this trend was altered by a declining wedge pattern set off by the bears, which reached its intraday low of $25.3 during early trading hours.

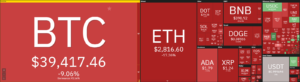
Generally, the cryptocurrency heat map is trading in bullish momentum. The giant asset Bitcoin is up by 3 percent, while the second-largest digital asset has risen by one percent. Despite the general view of the cryptocurrency heat map been green, some altcoins have recorded massive price deviations. AFIN has recorded the highest losses of more than 40 percent. Cosmos is trading at 26.4, which is a 3 percent surge from the intraday highs.
Cosmos price movement in the last 24 hours: ATOM/USD trades in a tight range
The daily Cosmos price analysis chart has been trading in a bullish trend. The ATOM/USD price ranged between $25.4-$27.0. The Bollinger bands have been narrow throughout the daily price analysis chart signaling a low volatile market.
The volume of trade in the cosmos market has increased by 10% to $556.4 million since April 8th. Meanwhile, the total market capitalization has grown by 5.23 percent, reaching $5.6 billion.
ATOM/USD four-hour price analysis chart: Bullish trend
However, there is low volatility experienced by ATOM/USD; the bulls seem to be taking the wheels and are set to be advancing towards the intraday high. If the sellers are not strong enough, the bulls will break through the resistance.

The price is above the 20-day moving average, which means the buyers have more strength than the sellers. The bull trend is set to continue throughout the remaining trading session on the daily price chart as bears seem not to be coming to the market anytime soon to stop the bull trend.
Cosmos price analysis: Conclusion
ATOM/USD will continue trading bullishly in the next 24 hours. Most of the technical indicators suggest that the weak bears will not curb the bull trend. Investors should make an effort to invest now as the ATOM/USD bull run will continue in the next 24hours.
Disclaimer. The information provided is not trading advice. Cryptopolitan.com holds no liability for any investments made based on the information provided on this page. We strongly recommend independent research and/or consultation with a qualified professional before making any investment decisions.
Source: https://api.follow.it/track-rss-story-click/v3/tHfgumto13Djg_2eBHw_J6gHTd9OkkKt
- Action
- advice
- Altcoins
- analysis
- April
- asset
- Bears
- Billion
- Bull Run
- Bullish
- Bulls
- capitalization
- coming
- continue
- Cosmos
- cryptocurrency
- data
- digital
- Digital Asset
- Early
- General
- Green
- head
- High
- HTTPS
- information
- investment
- Investments
- Investors
- liability
- Majority
- Making
- map
- Market
- Market Capitalization
- million
- Momentum
- Pattern
- price
- Price Analysis
- price surge
- research
- Run
- Sellers
- set
- surge
- Technical
- token
- trade
- trades
- Trading
- View
- Volatility
- volume
- week