- Since its 1 December 2022 high, the Dow Jones Industrial Average has evolved into a major “Expanding Wedge” range configuration.
- In the short-term, no clear signs of upside momentum as its price actions are being capped below the 20-day moving average.
- Key short-term resistance to watch will be at 33,580.
The Dow Jones Industrial Average (DJIA) is one of the underperforming major US stock indices together with the Russell 2000 so far with a recent weekly loss of -1.11% for the week of 8 May and a 2023 year-to-date return of 0.46% against the Nasdaq 100 (+0.61%/21.94%) and S&P 500 (-0.29%/7.41%).
DJIA Technical Analysis – Potential short-term weakness below 33,580 key resistance
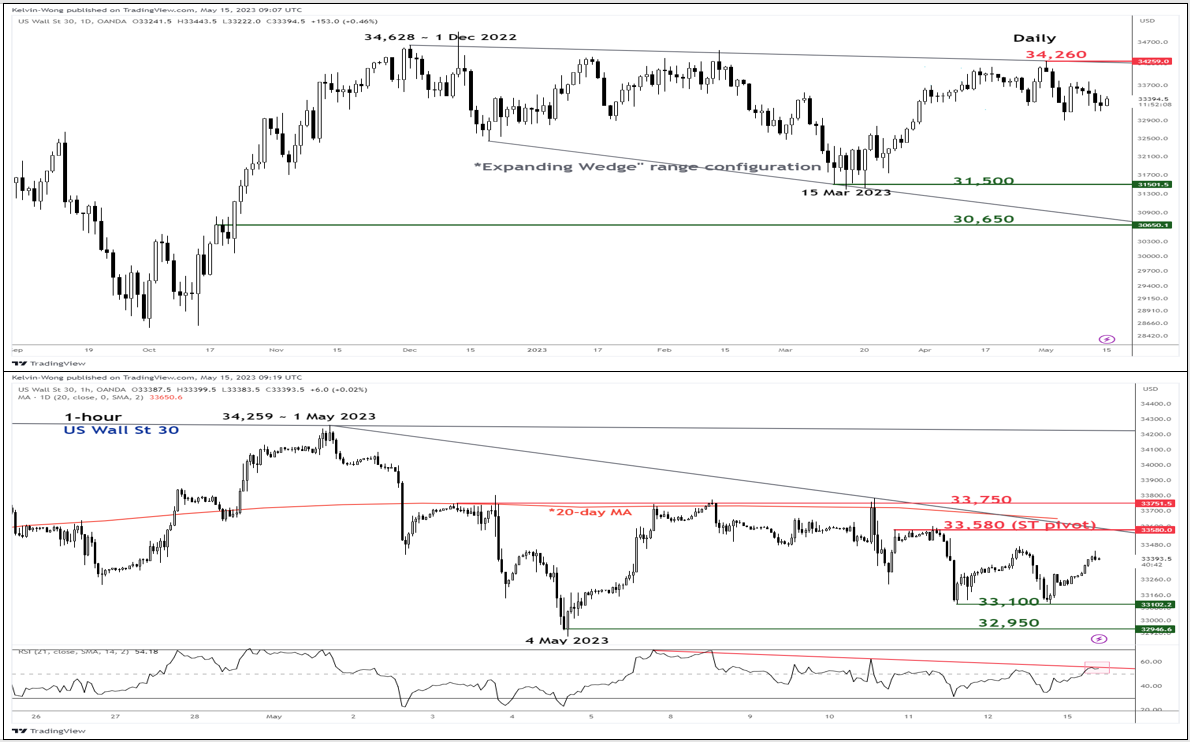
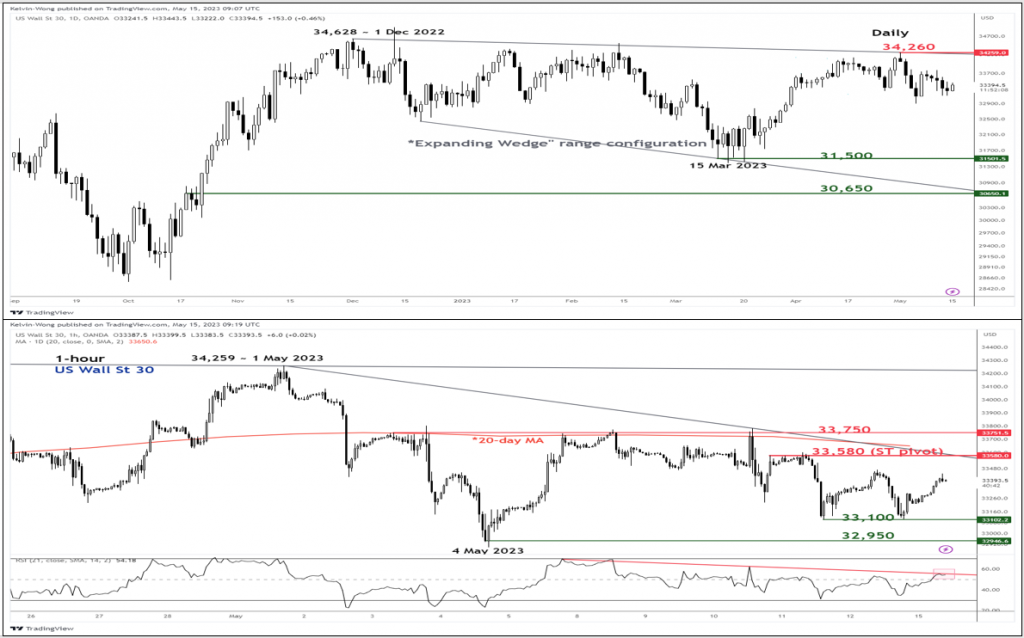
Fig 1: DJIA trend as of 15 May 2023 (Source: TradingView, click to enlarge chart)
Since its 1 December 2022 high of 34,628, the US Wall St 30 Index (proxy of the Dow Jones Industrial Average futures) has started to evolve into a major “Expanding Wedge” range configuration as depicted on the daily chart.
An important point to note is that the Dow Jones Industrial Average is one of the underperforming major US stock indices together with the Russell 2000 so far with a recent weekly loss of -1.11% for the week of 8 May and a 2023 year-to-date return of 0.46% against the Nasdaq 100 (+0.61%/21.94%) and S&P 500 (-0.29%/7.41%).
On a shorter-term frame, using the 1-hour chart, the Index has so far failed to make any headways above its slightly downward-sloping 20-day moving average now acting as a resistance at around 33,580 since the recent break below it on 2 May 2023. In addition, the 1-hour RSI oscillator has remained below a corresponding descending resistance at around the 56% level.
These observations suggest a potential build-up in short-term downside momentum. A break below minor support at 33,100 may expose the 4 May 2023 swing low area at 32,950. On the other hand, a clearance with an hourly close above the 33,580 key short-term pivotal resistance negates the bearish tone to see the next resistance coming in at 33,750 (minor swing high areas of 3 May/8 May/10 May 2023).
Content is for general information purposes only. It is not investment advice or a solution to buy or sell securities. Opinions are the authors; not necessarily that of OANDA Business Information & Services, Inc. or any of its affiliates, subsidiaries, officers or directors. If you would like to reproduce or redistribute any of the content found on MarketPulse, an award winning forex, commodities and global indices analysis and news site service produced by OANDA Business Information & Services, Inc., please access the RSS feed or contact us at info@marketpulse.com. Visit https://www.marketpulse.com/ to find out more about the beat of the global markets. © 2023 OANDA Business Information & Services Inc.
Latest posts by Kelvin Wong (see all)
- SEO Powered Content & PR Distribution. Get Amplified Today.
- PlatoAiStream. Web3 Data Intelligence. Knowledge Amplified. Access Here.
- Minting the Future w Adryenn Ashley. Access Here.
- Buy and Sell Shares in PRE-IPO Companies with PREIPO®. Access Here.
- Source: https://www.marketpulse.com/indices/djia-technical-capped-below-the-20-day-moving-average/kwong
- :has
- :is
- :not
- ][p
- 1
- 100
- 15 years
- 15%
- 2022
- 2023
- 30
- 500
- 8
- a
- About
- above
- access
- actions
- addition
- advice
- affiliates
- against
- an
- analysis
- and
- any
- ARE
- AREA
- areas
- around
- AS
- At
- author
- authors
- avatar
- average
- award
- BE
- bearish
- being
- below
- Box
- Break
- business
- buy
- by
- Chart
- clear
- clear signs
- click
- Close
- COM
- combination
- coming
- Commodities
- conducted
- Configuration
- Connecting
- contact
- content
- Corresponding
- courses
- daily
- December
- Directors
- dow
- Dow Jones
- Dow Jones Industrial Average
- downside
- Elliott
- enlarge
- Ether (ETH)
- evolve
- evolved
- exchange
- experience
- expert
- Failed
- far
- financial
- Find
- flow
- For
- foreign
- foreign exchange
- forex
- found
- FRAME
- fund
- fundamental
- Futures
- General
- Global
- global markets
- hand
- High
- HTTPS
- if
- important
- in
- Inc.
- index
- Indices
- industrial
- information
- into
- investment
- IT
- ITS
- Kelvin
- Key
- Last
- Level
- levels
- like
- loss
- Low
- Macro
- major
- make
- Market
- market outlook
- market research
- MarketPulse
- Markets
- max-width
- May..
- minor
- Momentum
- more
- moving
- moving average
- Nasdaq
- Nasdaq 100
- necessarily
- news
- next
- no
- now
- numerous
- of
- officers
- on
- ONE
- only
- Opinions
- or
- Other
- out
- Outlook
- over
- passionate
- perspectives
- pivotal
- plato
- Plato Data Intelligence
- PlatoData
- please
- Point
- positioning
- Posts
- potential
- price
- Produced
- providing
- proxy
- purposes
- range
- recent
- remained
- research
- Resistance
- retail
- return
- Reversal
- rsi
- rss
- S&P
- S&P 500
- Securities
- see
- sell
- senior
- service
- Services
- sharing
- short-term
- Signs
- since
- Singapore
- site
- So
- so Far
- solution
- Source
- specializing
- started
- stock
- Stock markets
- Strategist
- suggest
- support
- Swing
- Technical
- Technical Analysis
- ten
- that
- The
- thousands
- to
- together
- TONE
- Traders
- Trading
- TradingView
- Training
- Trend
- unique
- Upside
- us
- using
- v1
- Visit
- Wall
- Watch
- Wave
- weakness
- week
- weekly
- WELL
- will
- winning
- with
- would
- years
- you
- zephyrnet