Despite
good economic data like lower core inflation, stable jobless claims, lower
inflation expectations and strong consumer spending that support the
soft-landing narrative, the Dow Jones just keeps on falling with very shallow
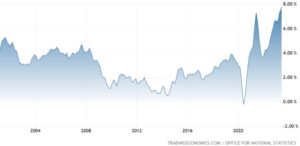
pullbacks. One of the main reasons might be the non-stop rally in long term
yields and real yields as it makes financial conditions tighter ultimately
weighing on the stock market. The good economic data might also be interpreted
as bad news because inflation might remain higher for longer requiring more
tightening from the Fed. There’s no easy answer at the moment, so the
technicals should be more helpful.
Dow Jones Technical
Analysis – Daily Timeframe
Dow Jones Daily
On the daily chart, we can see that the Dow Jones
has reached a key support level
where we can also find the 50% Fibonacci retracement level.
The fakeout above the key 35289 resistance is undoubtedly a bad omen for the
buyers, but a lot will depend on what happens around this support zone. In
fact, we should see the buyers stepping in here with a defined risk below the
support to target the breakout again. The sellers, on the other hand, will want
to see the price breaking lower to pile in even more aggressively and extend
the fall into the 33805 level.
Dow Jones Technical
Analysis – 4 hour Timeframe
Dow Jones 4 hour
On the 4 hour chart, we can see that the price
yesterday fell below the major trendline which is
another bearish signal but it would be confirmed only if the price breaks below
the key support as well. Otherwise, we might see a fakeout if the price bounces
strongly here and then rallies towards the 35289 resistance.
Dow Jones Technical
Analysis – 1 hour Timeframe
Dow Jones 1 hour
On the 1 hour chart, we can see that we
have a minor divergence with
the MACD right
at the support zone. This is generally a sign of weakening momentum often
followed by pullbacks or reversals. In this case, we should see a pullback into
the downward trendline where we will also find the confluence of the
Fibonacci retracement levels and the broken major trendline. The sellers are
likely to lean on the downward trendline with a defined risk above it to target
the break below the key support. The buyers, on the other hand, will want to
see the price breaking higher to pile in even more aggressively and extend the
rally into the resistance confirming the reversal.
Upcoming Events
The only top tier economic indicator left
is the US Jobless Claims report
scheduled for today. The market has been weak in the past days even in the face
of good data, so we might be at a point where bad data causes recessionary
fears and good data leads to higher rates expectations. It’s possible that the
market is more likely to react positively to data that it’s not too cold nor
too hot, so big deviations might be bearish either way.
- SEO Powered Content & PR Distribution. Get Amplified Today.
- PlatoData.Network Vertical Generative Ai. Empower Yourself. Access Here.
- PlatoAiStream. Web3 Intelligence. Knowledge Amplified. Access Here.
- PlatoESG. Automotive / EVs, Carbon, CleanTech, Energy, Environment, Solar, Waste Management. Access Here.
- PlatoHealth. Biotech and Clinical Trials Intelligence. Access Here.
- ChartPrime. Elevate your Trading Game with ChartPrime. Access Here.
- BlockOffsets. Modernizing Environmental Offset Ownership. Access Here.
- Source: https://www.forexlive.com/technical-analysis/dow-jones-technical-analysis-watch-what-happens-at-this-key-support-20230817/
- :has
- :is
- :not
- :where
- 1
- a
- above
- again
- also
- analysis
- and
- Another
- answer
- ARE
- around
- AS
- At
- Bad
- bad data
- BE
- bearish
- because
- been
- below
- Big
- Break
- Breaking
- breakout
- breaks
- Broken
- but
- buyers
- by
- CAN
- case
- causes
- Chart
- claims
- cold
- conditions
- CONFIRMED
- consumer
- Core
- core inflation
- daily
- data
- Days
- defined
- dow
- Dow Jones
- downward
- easy
- Economic
- either
- Even
- expectations
- extend
- Face
- fact
- Fall
- Falling
- fears
- Fed
- Fibonacci
- Fibonacci retracement levels
- financial
- Find
- followed
- For
- from
- generally
- good
- hand
- happens
- Have
- helpful
- here
- higher
- HOT
- hour
- HTTPS
- if
- in
- Indicator
- inflation
- Inflation expectations
- into
- IT
- jobless claims
- jones
- jpg
- just
- Key
- Leads
- left
- Level
- levels
- like
- likely
- Long
- longer
- Lot
- lower
- Main
- major
- MAKES
- Market
- might
- minor
- moment
- Momentum
- more
- NARRATIVE
- news
- no
- nor
- of
- often
- Omen
- on
- ONE
- only
- or
- Other
- otherwise
- past
- plato
- Plato Data Intelligence
- PlatoData
- Point
- possible
- price
- pullback
- rallies
- rally
- Rates
- reached
- React
- real
- reasons
- remain
- report
- Resistance
- retracement
- Reversal
- right
- Risk
- scheduled
- see
- Sellers
- shallow
- should
- sign
- Signal
- So
- soft-landing
- Spending
- stable
- stepping
- stock
- stock market
- strong
- strongly
- support
- Target
- Technical
- Technical Analysis
- term
- that
- The
- the Fed
- then
- this
- tier
- tightening
- tighter
- to
- today
- too
- top
- towards
- Ultimately
- undoubtedly
- very
- want
- Watch
- Way..
- we
- weighing
- WELL
- What
- which
- will
- with
- would
- yesterday
- yields
- zephyrnet