Ethereum price extended its increase above the $2,000 resistance against the US Dollar. ETH is slowly moving lower and might decline if it breaks the $2,075 support.
- Ethereum started a strong increase above the $2,000 and $2,050 resistance levels.
- The price is trading above $2,000 and the 100-hourly Simple Moving Average.
- There is a major bullish trend line forming with support near $2,090 on the hourly chart of ETH/USD (data feed via Kraken).
- The pair could start a downside correction below the $2,075 support zone.
Ethereum Price Faces Resistance
Ethereum’s price gained pace after there was a clear move above the $2,000 resistance zone. ETH even climbed above the $2,080 resistance zone before the bears appeared near the $2,120 zone.
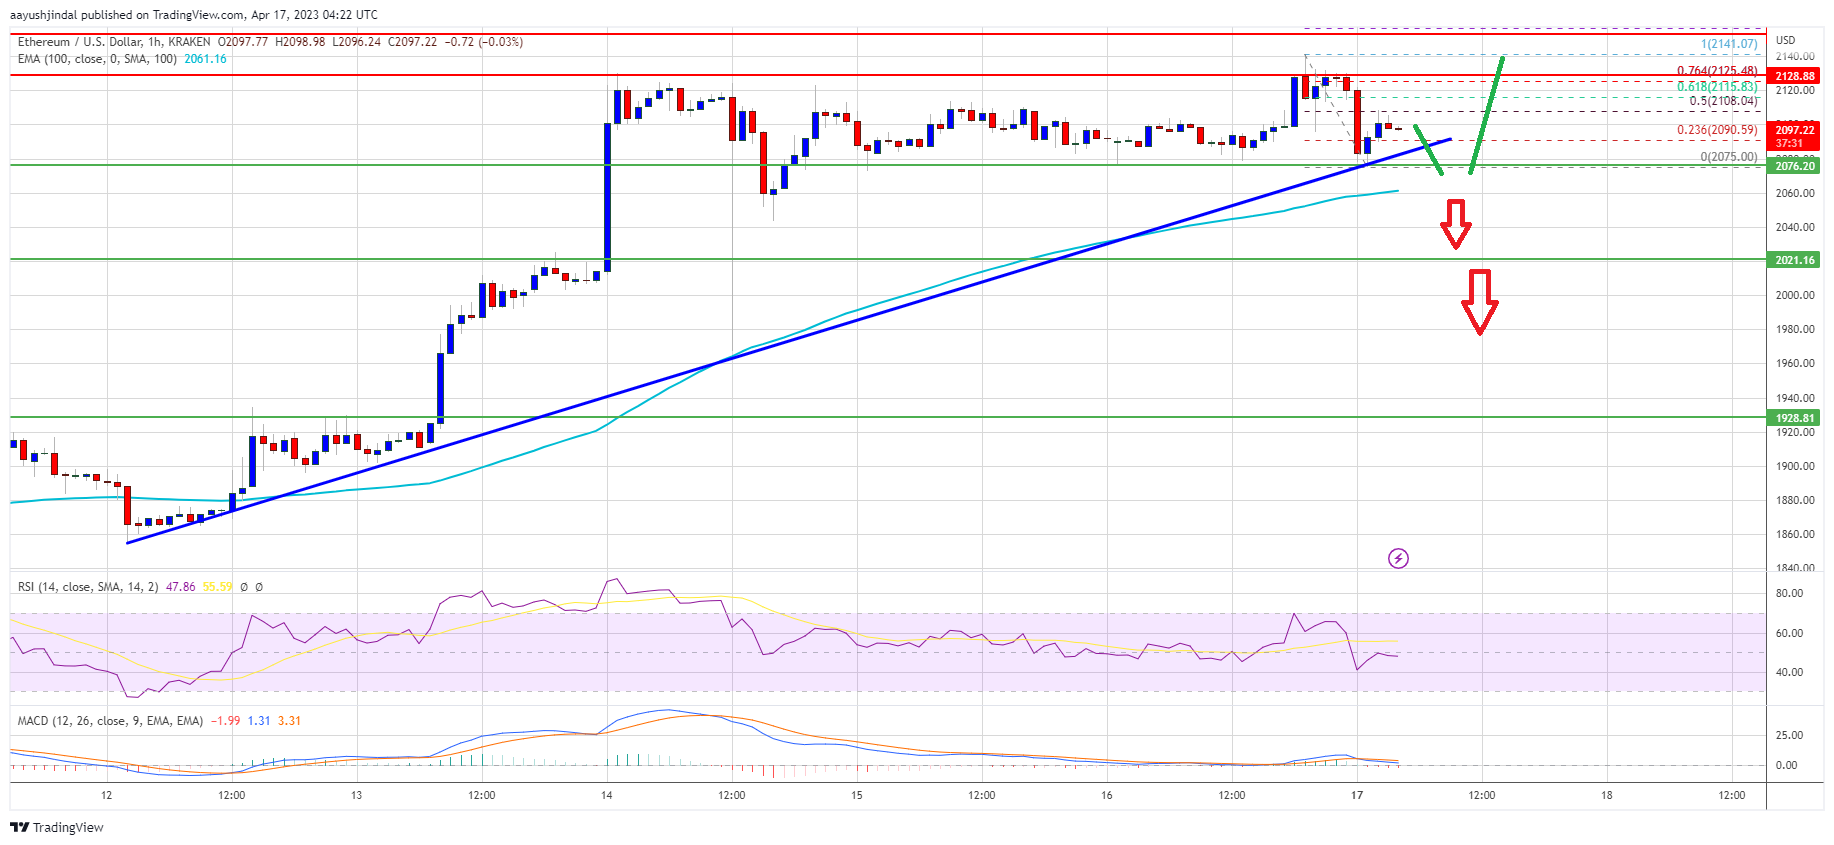
A high was formed near the $2,141 level before the price started a downside correction, similar to Bitcoin. There was a move below the $2,100 level but the downsides were limited. A low is formed near $2,075 and the price is now consolidating gains.
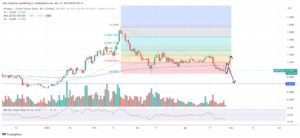
Ether price trading above $2,000 and the 100-hourly Simple Moving Average. There is also a major bullish trend line forming with support near $2,090 on the hourly chart of ETH/USD. Immediate resistance is near the $2,110 zone. It is near the 50% Fib retracement level of the downward move from the $2,141 swing high to the $2,075 low.
The next major resistance is near the $2,125 zone or the 76.4% Fib retracement level of the downward move from the $2,141 swing high to the $2,075 low.

Source: ETHUSD on TradingView.com
A close above the $2,125 resistance zone could start another strong increase. In the stated case, the bulls might aim for a move toward the $2,200 resistance. Any more gains could set the pace for a test of the $2,320 resistance.
Downside Break in ETH?
If Ethereum fails to clear the $2,125 resistance, it could start a downside correction. Initial support on the downside is near the $2,090 level and trend line.
The next major support is near the $2,075 zone, below which ether price might decline toward the $2,020 level. The main support is now forming near the $1,925 and $1,920 levels.
Technical Indicators
Hourly MACD – The MACD for ETH/USD is now losing momentum in the bullish zone.
Hourly RSI – The RSI for ETH/USD is just below the 50 level.
Major Support Level – $2,075
Major Resistance Level – $2,125
- SEO Powered Content & PR Distribution. Get Amplified Today.
- Platoblockchain. Web3 Metaverse Intelligence. Knowledge Amplified. Access Here.
- Minting the Future w Adryenn Ashley. Access Here.
- Source: https://www.newsbtc.com/analysis/eth/ethereum-bulls-take-breather-2075/
- :is
- 000
- 100
- 110
- a
- above
- After
- against
- and
- Another
- appeared
- average
- Bears
- before
- below
- Break
- breaks
- Bullish
- Bulls
- bulls might aim
- case
- Chart
- clear
- Climbed
- Close
- consolidating
- could
- data
- Decline
- Dollar
- downside
- downsides
- downward
- ETH
- ETH/USD
- Ether
- Ether Price
- ethereum
- ethereum bulls
- Ethereum Price
- Even
- faces
- fails
- For
- formed
- from
- Gains
- High
- HTTPS
- immediate
- in
- Increase
- initial
- IT
- ITS
- Kraken
- Level
- levels
- Limited
- Line
- losing
- Low
- MACD
- Main
- major
- max-width
- might
- Momentum
- more
- move
- moving
- moving average
- Near
- NewsBTC
- next
- of
- on
- Pace
- plato
- Plato Data Intelligence
- PlatoData
- price
- Resistance
- retracement
- rsi
- scenario
- set
- similar
- Simple
- Slowly
- start
- started
- stated
- strong
- support
- support level
- Swing
- Take
- test
- The
- to
- toward
- Trading
- TradingView
- Trend
- trigger
- us
- US Dollar
- via
- which
- with
- zephyrnet