Hedera Hashgraph is a blockchain-based enterprise-grade network that facilitates the development of customized digital assets. This decentralized ecosystem is powered by the network’s in-house token HBAR. It is a speedy and safe platform for the creation of Next-gen decentralized apps. The following HBAR technical analysis will predict the price trends for the next two days:
Past Performance
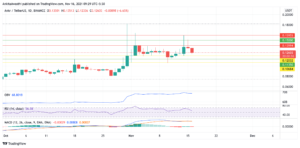
On May 31, 2021, HBAR opened at $0.22. On Jun 6, 2021, HBAR closed at $0.23. Thus, in the past week, the HBAR price hasn’t increased much. In the last 24 hours, HBAR has traded between $0.227-$0.233.

Day-Ahead and Tomorrow
Currently, HBAR is trading at $0.231. The price has increased from the day’s opening price of $0.229. Thus, the market seems bullish.
The MACD and signal lines are negative. Thus, the overall market momentum is bearish. However, a bullish crossover by the MACD line over the signal line has occurred. Hence, we can expect an intermittent price rise or trend reversal.
Currently, the RSI indicator is at 52%. It faced rejection at 43% and rose to the current level. Thus, buying pressures are high. Thus, the RSI oscillator is giving further credence to an impending HBAR price rise indicated by the MACD oscillator.
Besides, the OBV indicator has started rising steadily. Thus, buying volumes are slowly overtaking selling volumes. High buying activity will push the HBAR price upwards.
In short, all three oscillators have pointed towards a price rise. However, we have to wait and watch if this price increase is a temporary corrective action or the beginning of a bullish trend.
HBAR Technical Analysis
Currently, the price is below the first Fibonacci pivot resistance level of $0.233. The price may soon break out of it. It may even surpass the subsequent resistance levels of $0.234 and $0.237, respectively. Thereafter, we have to wait and watch, if the rising trend sustains till the day’s end.
The price has tested and fallen below the 38.2% FIB retracement level of $0.231. It may soon surpass this level. It may further breach the 23.6% FIB retracement level of $0.232. If the price retests and falls below this level by day close, then the bears are strong. In that case, the price downtrend will continue tomorrow as well.
- "
- 2021
- Action
- active
- All
- analysis
- apps
- Assets
- bearish
- Bears
- border
- breach
- Bullish
- Buying
- closed
- continue
- Cryptoknowmics
- Current
- day
- decentralized
- Development
- digital
- Digital Assets
- ecosystem
- Figure
- Giving
- Health
- High
- HTTPS
- impending
- Increase
- IT
- Level
- Line
- MACD
- Market
- Momentum
- Pivot
- platform
- Posts
- price
- records
- Reports
- safe
- Short
- started
- Technical
- Technical Analysis
- temporary
- token
- Tourism
- Trading
- Trends
- wait
- Watch
- week