Chainlink is an Oracle-based decentralized public blockchain network powered by smart contracts. It is a highly reliable, hack-free, and agile network. It also provides a robust infrastructure for the development and deployment of innovative decentralized apps on multiple interconnected blockchains. LINK is the native token of this ecosystem and the technical analysis is as follows:
Past Performance
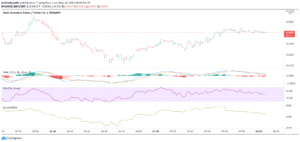
On May 21, 2021, LINK opened at $30.68. On May 27, 2021, LINK closed at $31.73. Thus, in the past week, the LINK price has increased by roughly 3%. In the last 24 hours, LINK has traded between $30.60-$32.18.

Day-Ahead and Tomorrow
Currently, LINK is trading at $32.10. The price has increased from the day’s opening price of $31.73. Thus, the market seems bullish.
Both MACD and signal lines are positive. Thus, the overall market momentum is positive. However, both the lines are close to the zero line and a bearish crossover by the MACD line over the signal line has occurred. Thus, the market momentum may turn negative soon.
Currently, the RSI indicator is at 56%. It faced rejection at 62% and fell to the current level. Thus, selling pressures are higher than buying pressures.
The A/D indicator is steadily rising. Hence, whale accumulations are slowly overtaking whale distributions. High buying activity will exert upward pressure on the LINK price.
In a nutshell, when we look at all three oscillators together, we can say that as of now, the bulls are strong. However, a price pullback or bullish trend reversal may occur soon. We have to wait and watch if the price pullback is temporary or the beginning of a price downtrend.
LINK Technical Analysis
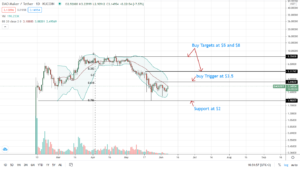
Currently, the price is above the Fibonacci pivot point of $31.50. The price may break out of the first Fibonacci pivot resistance level of $32.11 soon. Thereafter, we have to wait and watch if a price pullback or trend reversal occurs.
Presently, the price has tested and broken out of the 23.6% FIB retracement level of $31.80. If the price surpasses the 23.6% FIB extension level of $32.55 in some time, then probably the price uptrend is strong enough to sustain till tomorrow.
- "
- 11
- active
- Adoption
- All
- analysis
- apps
- bearish
- blockchain
- border
- breakout
- Bullish
- Bulls
- Buying
- Chainlink
- closed
- contracts
- countries
- Current
- decentralized
- Development
- ecosystem
- Figure
- First
- High
- history
- HTTPS
- Infrastructure
- IT
- Level
- Line
- LINK
- Market
- Momentum
- network
- Pivot
- Posts
- pressure
- price
- public
- public blockchain
- smart
- Smart Contracts
- Technical
- Technical Analysis
- temporary
- time
- token
- Trading
- wait
- Watch
- zero