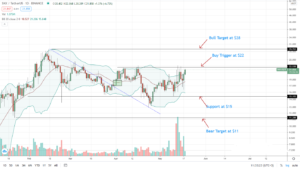
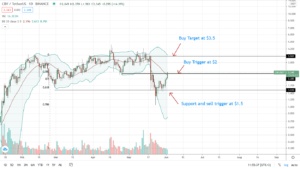
The extreme rise in selling pressure drives the LUNA coin price lower and may soon break the 100-day SMA to reach the $50 mark. Terra is an application used in blockchain technology that uses stablecoins paired with fiat. In order to power globally-based payment systems that are price-stable. Terra was launched at the beginning of January 2018 with the support of Daniel Shin and Do Kwon. The co-founders of the company aim to speed up the acceptance of blockchain technology with a focus on usability and the stability of prices. Let us move ahead to read about Terra’s technical analysis. Past Performance of LUNA LUNA coin price shows a decline of more than 15% in the past 24 hours resulting in the fallout of $75. Moreover, the free fall creates a huge bearish engulfing candlestick in the daily chart. It breaks below the 0.382 Fibonacci level and heads lower to the 0.5 Fibonacci level. LUNA/USD Daily Chart LUNA Technical Analysis The LUNA coin price decreased by 25% in the past week, resulting in a high momentum short-term downtrend. With the 180% jump in the intraday trading volume, the selling pressure is on the next level. The 20 and 50-day Simple Moving Averages give a bearish crossover in the daily chart. Meanwhile, the 100-day SMA provides support to falling prices. The 200-day SMA stands strong at $44 if the 100-day SMA collapses. The MACD indicator finally gives a bearish crossover after the merger of the MACD and signal lines in the daily chart. Moreover, the increasing trend in the falling histograms indicates a rise in underlying bearishness. The Stochastic RSI indicator shows a free fall in the K and D line in the daily chart after the rejection from the overbought boundary. Thus, the falling lines indicate a rise in selling pressure. Therefore, the technical indicators reflect a rise in underlying bearishness with the increased chances of a downfall below 100-day SMA. Upcoming Trend The LUNA coin price has come under extreme selling pressure extremely quickly due to the fall in the world’s oldest cryptocurrency below the $40K mark. The selling pressure may soon drive the prices below the 100-day SMA to the $55 mark or the 200-day SMA. This potential downfall will result in the fallout of the 0.5 Fibonacci level. However, if the prices find support near the 100-day SMA and continue to rise higher after consolidation, the resistance levels are at $75 and $87. At press time, TradinView gives a “SELL” signal for the LUNA coin. Technical Analysis for LUNAUSD by TradingView
The post LUNA Technical Analysis: Sellers Line-Up for Terra, Soon to Reach $50 appeared first on Cryptoknowmics-Crypto News and Media Platform.
- "
- About
- analysis
- Application
- bearish
- Beginning
- blockchain
- blockchain technology
- chances
- co-founders
- Coin
- company
- consolidation
- continue
- cryptocurrency
- Display
- fallout
- Fiat
- Finally
- First
- Focus
- Free
- High
- HTTPS
- huge
- increased
- IT
- January
- jump
- Level
- Line
- mark
- Media
- Momentum
- move
- Near
- news
- order
- payment
- Payment Systems
- performance
- power
- press
- pressure
- price
- provides
- Sellers
- Simple
- speed
- Stability
- Stablecoins
- strong
- support
- Systems
- Technical
- Technical Analysis
- Technology
- Terra
- time
- Trading
- us
- usability
- volume
- week
- world’s