
The more hawkish than expected revision to the FOMC Dot Plot last
week keeps on weighing on the Nasdaq Composite as the market might starting to
be worrying that the Fed could go further with its tightening cycle and
eventually lead to a recession. Fed Chair Powell has also
admitted that the soft-landing scenario is not his base case at the moment, despite
the good macroeconomic projections. Yesterday, we also got Fed’s Kashkari attributing
a 60% chance on the soft landing scenario, but a 40% chance on significant
hikes ahead. The rally in Treasury yields is also putting some pressure on the
Nasdaq Composite as financial conditions continue to tighten.
Nasdaq Composite Technical
Analysis – Daily Timeframe
Nasdaq Composite Daily
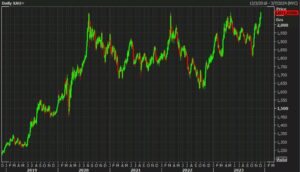
On the daily chart, we can see that the Nasdaq
Composite is breaking out of the key support area
around the 13174 level defined by the trendline and the
38.2% Fibonacci retracement level.
This breakout opened the door for a much bigger fall into the next support
around the 12274 level. The buyers will want to see the price bouncing back
strongly above the support zone and leave behind a fakeout to start looking for
higher prices.
Nasdaq Composite Technical
Analysis – 4 hour Timeframe
Nasdaq Composite 4 hour
On the 4
hour chart, we can see more closely the breakout with the price starting get a
bit overstretched on the downside as depicted by the distance from the blue 8 moving average. In such
instances, we can generally see a pullback into the moving average or some
consolidation before the next impulse.
Nasdaq Composite Technical
Analysis – 1 hour Timeframe
Nasdaq Composite 1 hour
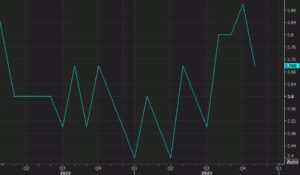
On the 1 hour chart, we can see that we
have a divergence with
the MACD right
when the price is breaking out. This is generally a sign of weakening momentum
often followed by pullbacks or reversals. In this case, we might see a pullback
into the downward trendline where we have also the confluence with
the 38.2% Fibonacci retracement level. That’s where the sellers are likely to
step in with a defined risk above the trendline to position for another
selloff. The buyers, on the other hand, will want to see the price breaking
above the trendline to confirm the fakeout and pile in to target the highs.
Upcoming
Events
Tomorrow we will see the latest US Jobless Claims
report. At the moment, it looks like bad data or good data all lead to further
downside as the former might point to a recession on the horizon and the latter
is likely to keep the Fed hawkish and even force to raise rates further.
Nonetheless, the last time we got weak data on the labour market front, the
Nasdaq Composite rallied strongly, so this is something to watch out for. On
Friday, we conclude the week with the latest US PCE data.
- SEO Powered Content & PR Distribution. Get Amplified Today.
- PlatoData.Network Vertical Generative Ai. Empower Yourself. Access Here.
- PlatoAiStream. Web3 Intelligence. Knowledge Amplified. Access Here.
- PlatoESG. Carbon, CleanTech, Energy, Environment, Solar, Waste Management. Access Here.
- PlatoHealth. Biotech and Clinical Trials Intelligence. Access Here.
- Source: https://www.forexlive.com/technical-analysis/nasdaq-composite-technical-analysis-the-bearish-bias-is-still-intact-20230927/
- :has
- :is
- :not
- :where
- 1
- 2%
- 8
- a
- above
- admitted
- ahead
- All
- also
- analysis
- and
- Another
- ARE
- AREA
- around
- AS
- At
- average
- back
- Bad
- bad data
- base
- BE
- bearish
- before
- behind
- bias
- bigger
- Bit
- Blue
- Breaking
- breakout
- but
- buyers
- by
- CAN
- case
- Chair
- Chance
- Chart
- claims
- closely
- conclude
- conditions
- Confirm
- consolidation
- continue
- could
- cycle
- daily
- data
- defined
- Despite
- distance
- Door
- DOT
- downside
- downward
- Even
- eventually
- expected
- Fall
- Fed
- Fibonacci
- financial
- followed
- For
- Force
- Former
- Friday
- from
- front
- further
- generally
- get
- Go
- good
- got
- hand
- Have
- Hawkish
- higher
- Highs
- Hikes
- his
- horizon
- hour
- HTTPS
- in
- into
- IT
- ITS
- jobless claims
- jpg
- Keep
- Key
- Labour
- landing
- Last
- latest
- lead
- Leave
- Level
- like
- likely
- looking
- LOOKS
- Macroeconomic
- Market
- might
- moment
- Momentum
- more
- moving
- moving average
- much
- Nasdaq
- next
- of
- often
- on
- opened
- or
- Other
- out
- pce
- plato
- Plato Data Intelligence
- PlatoData
- Point
- position
- pressure
- price
- Prices
- projections
- pullback
- Putting
- raise
- rally
- Rates
- recession
- report
- retracement
- right
- Risk
- scenario
- see
- Sellers
- SellOff
- sign
- significant
- So
- Soft
- soft-landing
- some
- something
- start
- Starting
- Step
- Still
- strongly
- such
- support
- Target
- Technical
- Technical Analysis
- than
- that
- The
- the Fed
- this
- tighten
- tightening
- time
- to
- treasury
- Treasury yields
- us
- US Jobless Claims
- want
- Watch
- we
- week
- weighing
- when
- will
- with
- worrying
- yesterday
- yields
- zephyrnet