Polkadot’s $28.6-support has held up during recent pullbacks and the same would likely be called into action in the coming days. Cosmos inched towards its first line of defense around the $23-mark. Lastly, sellers were likely to prevail in a battle against buyers for the Bitcoin Cash market.
Polkadot [DOT]

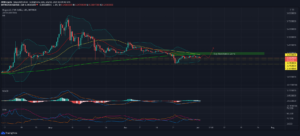
Source: DOT/USD, TradingView
At the time of writing, Polkadot traded at $37, down by nearly 7% in the last 24 hours. Its candlesticks on the daily charts slipped below their 20-SMA (red) and 50-SMA (black), while its technicals indicated further southbound action. Since mid-February, bulls have countered multiple pullbacks around $28.6. This area has proved to be a buy zone but a breakdown could severely hamper DOT’s recovery attempt towards record levels. If this area is breached by the sellers, a 25% retracement was possible all the way towards $21.1 and the 200-SMA (green).
MACD line was in danger of falling below the equilibrium mark and its histogram noted some bearish momentum. The Supertrend Indicator presented a sell signal but this can be flipped in case of a rise above $43.
Cosmos [ATOM]

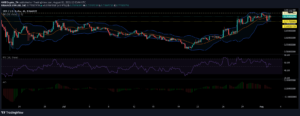
Source: ATOM/USD, TradingView
Similar to its counterpart DOT, Cosmos also saw sharp losses over the last 24 hours. The daily timeframe highlighted several support areas, but the $21-23 region was of particular significance as it clashed with the 20 (blue) and 50 SMA (yellow). Another prominent buy zone lay around $16.7. If these areas capitulate under selling pressure, ATOM could be in for an extended bearish U-turn. This outcome would only be amplified if $13 is also ceded to the bears.
After peaking in the overbought zone, Stochastic RSI noted a sharp drop towards 40, underlining an incoming correctional phase. According to Chaikin Money Flow, capital inflows remained healthy and could act as a buffer against a fall below the long-term moving average.
Bitcoin Cash [BCH]

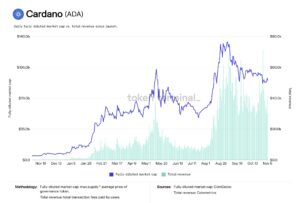
Source: BCH/USD, TradingView
Bitcoin Cash’s candlewicks on May 10 suggested a great degree of indecision in the market. While one end on the candlewick touched a high of $1,570, the other end dropped as low as $1,200. Such disparity suggested that BCH was being pulled in either direction by the sellers and buyers. With a broader market pullback currently in effect, it was likely that the sellers came out on top. The 4-hour timeframe showed that BCH found respite at the 50-SMA but a breakdown over the coming sessions could trigger a sharp sell-off towards $944.
MACD line lost distance on the Signal line and highlighted bearish market momentum. RSI maintained a bullish territory, but a dip below 50 was expected.
Source: https://ambcrypto.com/polkadot-cosmos-bitcoin-cash-price-analysis-11-may/
- 11
- 7
- Action
- All
- analysis
- AREA
- around
- Battle
- BCH
- bearish
- Bearish Momentum
- Bears
- Bitcoin
- Bitcoin Cash
- Black
- Bullish
- Bulls
- buy
- capital
- Cash
- Charts
- coming
- Cosmos
- Defense
- distance
- Drop
- dropped
- First
- great
- Green
- High
- Highlighted
- HTTPS
- IT
- Line
- mark
- Market
- Momentum
- money
- Other
- Polkadot
- pressure
- price
- Price Analysis
- recovery
- sell
- Sellers
- support
- time
- top
- writing