Polkadot (DOT) is following an ascending support line and has bounced at the $29 horizontal support area.
Ankr (ANKR) has broken out from a long-term descending parallel channel and validated it as support afterwards.
Celer Network (CELR) reached an all-time high price on Sept 26 but was rejected shortly afterwards.
DOT
DOT has been increasing alongside an ascending support line since July 20.
On Aug 31, the token managed to break out above the $29 resistance area and validated it as support twice afterwards. These re-tests also coincided with bounces at the support line.
Technical indicators provide a mixed outlook. While the MACD is positive, it is now moving upwards. Similarly, the RSI is right at the 50 line.
However, the Supertrend is bullish, and it coincides with both the $29 area and the ascending support line. Therefore, DOT is trading above a confluence of support levels.
The next closest resistance is at $41.35. It is the 0.786 Fib retracement resistance level and a horizontal resistance area.


The shorter-term two-hour chart shows that DOT is following a descending resistance line and has been doing so since Sept 14.
Until it manages to break out above it, the trend cannot be considered bullish.
A breakout would take it towards the previously outlined $41.35 resistance area.


Highlights
- DOT is following a long-term ascending support line.
- It is facing resistance from a short-term descending resistance line.
ANKR
ANKR has been trading inside a long-term descending parallel channel since reaching an all-time high price of $0.216 on March 28. This led to a low of $0.047 on June 22.
The token has been moving upwards since and on Aug 22 it managed to break out from the channel.
However, it has been decreasing since, possibly returning to validate the channel as support. Furthermore, both the RSI and MACD are decreasing. The validation has also coincided with a touch of the $0.08 support area.
Therefore, while the price action looks bullish, technical indicator reading are bearish.

The shorter-term two-hour chart shows that ANKR is trading inside a descending wedge. The wedge is considered a bullish reversal pattern.
Furthermore, the MACD and RSI are both moving upwards, supporting the possibility of a breakout.
Currently, the token is right at the resistance line of the pattern.
A movement above the $0.102 area would likely mean that ANKR is heading higher in the long-term.

Highlights
- ANKR has broken out from a long-term descending parallel channel.
- It is possibly trading inside a short-term descending wedge.
CELR
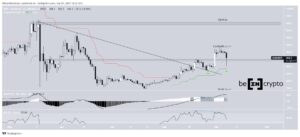
On Sept 15, CELR broke out from the $0.093 resistance area and moved upwards at an accelerated rate.
It initially fell and deviated below this level on Sept 21 (red circle), but has regained its footing and has been increasing since. On Sept 26, the token reached a new all-time high of $0.198. The high was made just slightly above the 1.61 external Fib retracement resistance level.
Currently, the token is trading just above this level, trying to validate it as support.
If it is successful in doing so, the next resistance area would be at $0.239. This is the 2.61 external Fib retracement resistance level.
Both the MACD and RSI are increasing, supporting the continuation of the upward movement.

Highlights
- CELR reached an all-time high price on Sept 26.
- It is trading above support at $0.155.
For BeInCrypto’s latest Bitcoin (BTC) analysis, click here.
What do you think about this subject? Write to us and tell us!
Disclaimer
All the information contained on our website is published in good faith and for general information purposes only. Any action the reader takes upon the information found on our website is strictly at their own risk.
Source: https://beincrypto.com/polkadot-dot-readies-for-breakout-while-ecosystem-tokens-flourish/
- Action
- All
- analysis
- analyst
- AREA
- barcelona
- bearish
- breakout
- BTC
- Bullish
- Circle
- cryptocurrencies
- cryptocurrency
- data
- discovered
- Economics
- ecosystem
- facing
- financial
- General
- good
- graduate
- High
- HTTPS
- information
- IT
- July
- Led
- Level
- Line
- March
- Markets
- mixed
- network
- Outlook
- Pattern
- Polkadot
- price
- Reader
- Reading
- Risk
- School
- So
- successful
- support
- Technical
- token
- Tokens
- touch
- Trading
- us
- Website
- websites
- writing