
TL;DR Breakdown
- Polkadot price is expected to fall from $27
- The closest support level lies at $26
- Polkadot price is faceing resistance at the $28 mark
Polkadot price has broken above the $25 mark and strong bullish momentum has carried the price to above the $27 mark. DOT price records an over 24 percent price hike across the last seven days showing strong bullish dominance. However, the sharp bullish activity leaves room for a volatile price movement.
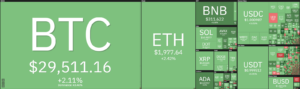
The broader cryptocurrency market enjoys a bullish sentiment across the 24 hours with most major cryptocurrencies recording profits across the timeframe. Major player includes Dogecoin and BNB that record a 7.55 and a 9.7 percent increase respectively. Meanwhile Bitcoin and Ethereum record a 3.66 and a 4.71 percent hike.
Technical indicators for DOT/USDT
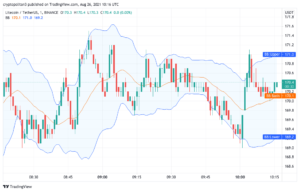
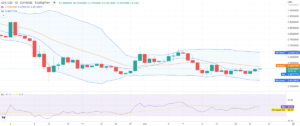
Across the technical indicators, the MACD shows strong bullish momentum as observed in the increasing size of the dark green histogram. The indicator exhibited a bullish reversal 3 days ago and has remained bullish since, and has steadily climbed up to the 1.36 mark. Across the EMAs, 12-EMAis trading above the 26-EMA with a high slope and continues diverging while both EMAs rise.
The RSI broke out of the neutral region today, and the indicator currently trades in the overbought region just below the 72.00 mark and moves downwards suggesting a bearish presence at the current price level. Moreover, the RSI trades with a steep slope suggesting bearish momentum is increasing giving an increasing sell signal
The Bollinger bands are currently wide but will converge rapidly in the immediate future as the bears take charge of the market momentum. The bands’ convergence suggests a drop in volatility for the Polkadot price in the short term. However, as the price is consolidating above the bands’ mean line, the bands will be leaning upwards for the next few candlesticks.
Overall the 4-hour technical analysis issues a buy signal with 13 of the total 26 major technical indicators suggesting their support for a bullish movement. On the other hand, only six indicators issue sell signals suggesting a bearish retracement. Meanwhile, seven indicators sit on the fence issuing no support for either side of the market.
The 24-hour technical analysis shares this sentiment and issues a weak buy signal with 9 of the 26 indicators suggesting a bullish movement against only seven indicators suggest a bearish retracement. Meanwhile, ten indicators remain neutral and do not issue any signals at the time of writing
What to expect from Polkadot price
Traders should expect the Polkadot price to move downwards towards the $25 mark as DOT price struggles to find support for an upwards movement as the midterm indicators are getting further bearish .Polkadot price may fall to $20 before recovering to challenge the $30 mark
Disclaimer. The information provided is not trading advice. Cryptopolitan.com holds no liability for any investments made based on the information provided on this page. We strongly recommend independent research and/or consultation with a qualified professional before making any investment decisions.
Source: https://www.cryptopolitan.com/polkadot-price-analysis-2021-06-03/
- 7
- 9
- advice
- analysis
- bearish
- Bearish Momentum
- Bears
- Bitcoin
- bnb
- Bullish
- buy
- challenge
- charge
- continues
- cryptocurrencies
- cryptocurrency
- cryptocurrency market
- Current
- Dogecoin
- Drop
- ethereum
- future
- Giving
- Green
- High
- HTTPS
- Increase
- information
- investment
- Investments
- issues
- Level
- liability
- Line
- major
- Making
- mark
- Market
- Momentum
- move
- Other
- player
- prediction
- price
- Price Prediction
- records
- research
- sell
- sentiment
- Shares
- Short
- SIX
- Size
- support
- support level
- Technical
- Technical Analysis
- time
- trades
- Trading
- Volatility