UMA/USDT and REEF/USDT technical analysis indicate buyers. They may drive REEF to $0.09 and UMA to $44, respectively.
Reef Finance (REEF)
The DeFi protocol built on Polkadot aims to enable cross-chain trading. Some of the dApp’s offerings include a smart liquidity aggregator and a yield engine.
Past Performance of REEF
REEF finance is presently trading at $0.05, around today’s high.
On the last trading day, REEF/USDT prices are ranging between $0.03 and $0.05.
Technically, REEF is in an uptrend as bulls take charge, adding 21 percent against the USD on the last trading day buoyed by a sharp uptick in trading volumes which rose 3X.
Day-Ahead and What to Expect
From the daily chart, there are hints of strength.
For instance, today’s bull bar is engulfing, possibly defining the short-term trend.
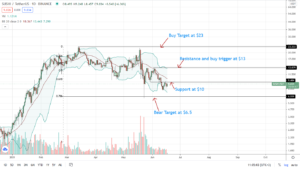
Nonetheless, REEF/USDT technical analysis reveals that prices are within a $0.025 zone with clear support at $0.025 and resistance at $0.05.
REEF/USDT Technical Analysis

Following today’s gains, REEF buyers have the upper hand.
Accordingly, traders can choose to load on dips on every pullback as they aim at $0.09—the 1.618 Fibonacci extension level of the Q1 2021–in the immediate term.
Unexpected dips below May 11 lows at $0.035 nullifies bulls’ optimism.
Universal Market Access (UMA)
From this protocol, users can create Ethereum-based synthetics of various real-world financial activities. UMA is its primary token.
Past Performance of UMA
Trading at $27, UMA/USDT prices remain in range, inside May 10 bull bar.
Considering traders’ interest in the past few days, the average trading volumes of the token is up 4X.
However, prices are still in a bull flag where they remain mainly in range.
On the last day, the price is up seven percent against the USD and roughly 13 percent versus BTC and ETH.
Day-Ahead and What to Expect
UMA/USDT technical analysis and fundamentals indicate buyers.
Still, for a clear trend definition, bulls must comprehensively close above the bull flag and preferably $35 with rising trading volumes.
Such a move would reverse losses of late April 2021 and set in motion the next wave higher.
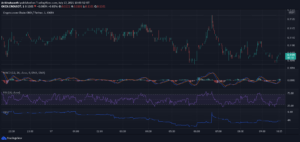
UMA/USDT Technical Analysis

The UMA/USDT price is bullish. With rising volumes, there has been a confirmation of the double-bar bullish reversal of April 24 and 25.
Aggressive UMA bulls may load the dips. However, a breakout above April 2021 highs and $35 may see UMA/USDT race to Q1 2021 highs of $44.
- "
- 11
- 2021
- access
- active
- activities
- analysis
- April
- around
- border
- breakout
- BTC
- Bullish
- Bulls
- charge
- Cross-Chain
- crypto
- Cryptoknowmics
- day
- DeFi
- ETH
- Figure
- finance
- financial
- Fundamentals
- High
- HTTPS
- interest
- Labs
- Level
- Liquidity
- load
- Market
- move
- Offerings
- Optimism
- performance
- Posts
- price
- Q1
- Race
- range
- reverse
- set
- smart
- support
- Technical
- Technical Analysis
- token
- Traders
- Trading
- USD
- users
- Versus
- Wallet
- Wave
- within
- world
- Yield