TL;DR Breakdown
- Ripple price analysis reveals that the cryptocurrency is stabilizing at the $1.06 range after the flash crash.
- The flash crash took the Ripple price as low as the $0.95 mark.
- Strong support is currently found at the $1.05 mark.
- Strong resistance is currently found at the $1.14 mark.
Ripple price analysis reveals that the altcoin has recovered rather poorly after the market went into a flash crash following the king Bitcoin. The altcoin is down by 22.70 percent in the past 24-hours and down by over 11 percent in the past seven days. It seems that the flash crash only added to Ripple’s problems since the altcoin was already going through some corrective movement before the price fall down in the flash crash. The cryptocurrency was trading at a $1.23 level when the flash crash occurred.
Ripple price analysis: 1 day candlestick shows bearish crossover similar to the market
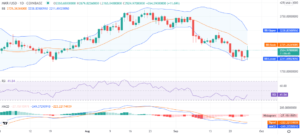
The 1-day candlestick Ripple price analysis chart is showing a similar bearish crossover as the other top coins, including Bitcoin, Ethereum, and Litecoin. The volatility has increased compared to the past 24-hours but is still on the lower end when compared to the past few days. The upper Bollinger band is found at the $1.366 mark showing the strongest resistance point, while the lower Bollinger band is present at the $1.035 mark presenting the strongest support mark.

The nine-day moving average (MA) and the Bollinger bands’ average are both marking bearish crossovers similar to other big coins. The nine-day MA is found at the $1.23 level, whereas the Bollinger bands’ average is found at the $1.20 mark. The relative strength index score stands at the 44.92 mark showing ample opportunity for buyers to build a bearish momentum through buying trends.
XRP/USD 4-hour price chart shows bearish momentum brewing
The four-hour candlestick Ripple price analysis chart shows that the Ripple price movement is largely bearish even on the short-term charts. In fact, the four-hour chart is showing more bearish indicators than the 1-day chart. The volatility has increased by many folds as compared to the past few weeks, and the upper Bollinger band is found at the $1.472 mark marking the strongest resistance.

Whereas the lower Bollinger band is found at the $1.057 mark right below the price marking a strong support level. Both the Bollinger bands’ average and the nine-day moving average (MA) are found above the current price marking bearish crossovers on the chart. The Bollinger bands’ average is found at the $1.26 mark, while the nine-day MA is found at the $1.21 mark. The RSI is also on the bearish side, with an oversold score of 28.61 at the time of writing.
Ripple price analysis conclusion
Ripple has been struck rather badly by the current flash crash and the bearish momentum that followed the Bitcoin price movement. The altcoin is struggling to keep the current support level, and the price is fluctuating between the $1.05 and $1.06 range at the time of writing. If the current support persists, the altcoin would be able to gain some bullish momentum in the days to come, but if the current support falters, the altcoin is likely to fall below $1.
Disclaimer. The information provided is not trading advice. Cryptopolitan.com holds no liability for any investments made based on the information provided on this page. We strongly recommend independent research and/or consultation with a qualified professional before making any investment decisions.
Source: https://api.follow.it/track-rss-story-click/v3/tHfgumto13CJAKGVRNitdCxhxzpi7FpJ
- 11
- advice
- Altcoin
- analysis
- bearish
- Bearish Momentum
- Bitcoin
- Bitcoin Price
- build
- Bullish
- Buying
- Charts
- Coins
- Crash
- cryptocurrency
- Current
- data
- day
- Flash
- HTTPS
- Including
- index
- information
- investment
- Investments
- IT
- King
- Level
- liability
- Making
- mark
- Market
- Momentum
- Opportunity
- Other
- present
- price
- Price Analysis
- range
- research
- Ripple
- Ripple Price Analysis
- support
- support level
- time
- top
- Trading
- Trends
- Volatility
- writing
- xrp