- Stellar lumen price is struggling below the $0.100 resistance zone against the US Dollar.
- XLM price is now trading below $0.0980 and the 55 simple moving average (4 hours).
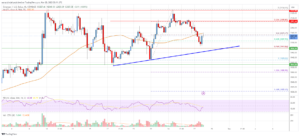
- There is a major bearish trend line forming with resistance near $0.0980 on the 4-hour chart (data feed via Kraken).
- The pair could start a recovery wave if it clears the $0.100 resistance.
Stellar lumen price is trading below $0.100 against the US Dollar, similar to Bitcoin. XLM price could extend losses if it stays below $0.100 for a long time.
Stellar Lumen Price Analysis (XLM to USD)
After a major decline below $0.100, Stellar Lumen price attempted a recovery wave against the US Dollar. The XLM/USD pair climbed above $0.0950 but it failed to extend gains.
It resumed its decline and traded below the $0.0918 support. A low is formed near $0.0902 and the price is now attempting a fresh recovery wave. It was able to clear the 23.6% Fib retracement level of the downward move from the $0.1090 swing high to the $0.0902 low.
XLM is still trading below $0.0980 and the 55 simple moving average (4 hours). There is also a major bearish trend line forming with resistance near $0.0980 on the 4-hour chart.
On the upside, the price is facing resistance near the $0.0965 level. The next major resistance is near the $0.0980 zone and the trend line. The first major resistance is near the $0.100 level or the 61.8% Fib retracement level of the downward move from the $0.1090 swing high to the $0.0902 low.
A clear upside break above the $0.100 zone might send the price toward $0.1080. Any more gains could lead the price toward the $0.1120 level or even $0.1200.
Initial support on the downside is near the $0.0918 level. The main support is near the $0.090 zone. Any more losses could lead the price toward the $0.0865 level in the near term, below which the price might even retest $0.0850.

Stellar Lumen (XLM) Price
The chart indicates that XLM price is now trading below $0.0980 and the 55 simple moving average (4 hours). Overall, the price could start a major decline if there is a clear move below the $0.090 support.
Technical Indicators
4 hours MACD – The MACD for XLM/USD is gaining momentum in the bearish zone.
4 hours RSI – The RSI for XLM/USD is now below the 50 level.
Key Support Levels – $0.0920 and $0.090.
Key Resistance Levels – $0.0965, $0.0980, and $0.100.
- SEO Powered Content & PR Distribution. Get Amplified Today.
- PlatoAiStream. Web3 Data Intelligence. Knowledge Amplified. Access Here.
- Minting the Future w Adryenn Ashley. Access Here.
- Source: https://www.livebitcoinnews.com/stellar-lumen-xlm-price-could-recover-if-it-clears-0-10/
- :is
- 10
- 100
- 23
- 50
- a
- Able
- above
- against
- also
- analysis
- and
- any
- attempted
- attempting
- average
- bearish
- below
- Break
- but
- Chart
- clear
- Climbed
- comments
- could
- data
- Decline
- Dollar
- downside
- downward
- end
- Even
- extend
- facing
- Failed
- First
- follow
- For
- formed
- fresh
- from
- gaining
- Gains
- High
- HOURS
- HTTPS
- if
- in
- indicates
- internal
- IT
- ITS
- Kraken
- lead
- Level
- levels
- Line
- Long
- long time
- losses
- Low
- Lumen
- MACD
- Main
- major
- might
- Momentum
- more
- move
- moving
- moving average
- Near
- next
- now
- of
- on
- or
- overall
- plato
- Plato Data Intelligence
- PlatoData
- Post
- price
- Price Analysis
- Recover
- recovery
- Resistance
- retracement
- rsi
- send
- similar
- Simple
- start
- Stellar
- Stellar Lumen
- Still
- Struggling
- support
- support levels
- Swing
- TAG
- that
- The
- There.
- time
- to
- toward
- traded
- Trading
- TradingView
- Trend
- Upside
- us
- US Dollar
- USD
- via
- was
- Wave
- which
- with
- XLM
- xlm price
- XLM/USD
- zephyrnet