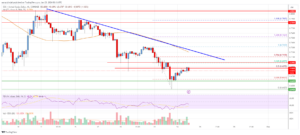
- Stellar lumen price started a downside correction from the $0.115 zone against the US Dollar.
- XLM price is now trading above $0.1060 and the 55 simple moving average (4 hours).
- There is a connecting bullish trend line forming with support near $0.1055 on the 4-hour chart (data feed via Kraken).
- The pair could start another increase if it clears the $0.1085 and $0.112 resistance levels.
Stellar lumen price is trading above $0.1050 against the US Dollar, similar to bitcoin. XLM’s price must stay above the $0.1020 support to rise again.
Stellar Lumen Price Analysis (XLM to USD)
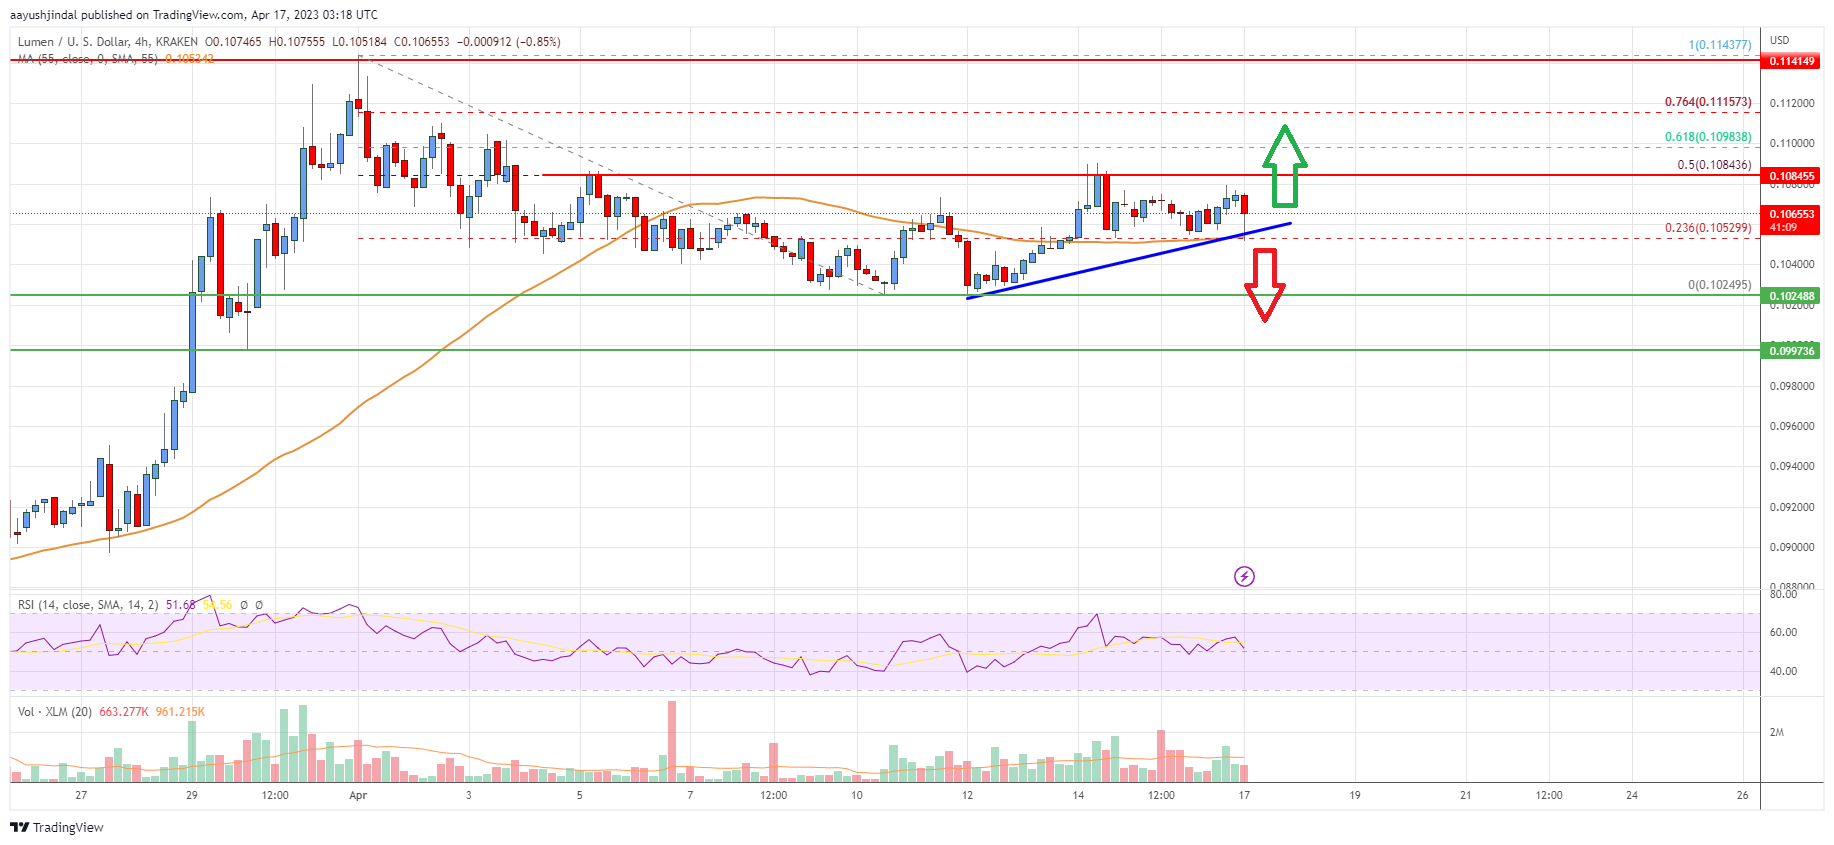
After forming a base above the $0.100 level, Stellar lumen price started a fresh increase against the US Dollar. The XLM/USD pair broke the $0.108 resistance zone to move into a positive zone.
The price even cleared the $0.1120 resistance and the 55 simple moving average (4 hours). The upward move was such that the price spike to $0.1150 before it corrected lower. There was a drop below the $0.1085 support level. However, the bulls were active near the $0.1020 level.
A low is formed near $0.1024 and the price is now attempting a fresh increase. It is now trading above $0.1060 and the 55 simple moving average (4 hours). There is also a connecting bullish trend line forming with support near $0.1055 on the 4-hour chart.
On the upside, the price is facing resistance near the $0.1085 zone. It is close to the 50% Fib retracement level of the downward move from the $0.1143 swing high to the $0.1024 low.
The next major resistance is near the $0.1115 level or the 76.4% Fib retracement level of the downward move from the $0.1143 swing high to the $0.1024 low. A clear move above the $0.1115 level might send the price toward the $0.1150 level. Any more gains could lead the price toward the $0.1200 level or even $0.1250.
Initial support on the downside is near the $0.1065 level or the trend line. The next major support sits near the $0.1020 level. Any more losses could lead the price toward the $0.0975 level in the near term.

Stellar Lumen (XLM) Price
The chart indicates that XLM’s price is now trading above $0.1050 and the 55 simple moving average (4 hours). Overall, the price could start another increase if it clears the $0.1085 and $0.112 resistance levels.
Technical Indicators
4 hours MACD – The MACD for XLM/USD is losing momentum in the bullish zone.
4 hours RSI – The RSI for XLM/USD is now above the 50 level.
Key Support Levels – $0.102 and $0.0975.
Key Resistance Levels – $0.1085, $0.1115, and $0.1150.
- SEO Powered Content & PR Distribution. Get Amplified Today.
- Platoblockchain. Web3 Metaverse Intelligence. Knowledge Amplified. Access Here.
- Minting the Future w Adryenn Ashley. Access Here.
- Source: https://www.livebitcoinnews.com/stellar-lumen-xlm-price-eyes-fresh-increase-above-0-112/
- :is
- 100
- 102
- a
- above
- active
- against
- analysis
- and
- Another
- attempting
- average
- base
- before
- below
- Broke
- Bullish
- Bulls
- Chart
- clear
- Close
- comments
- Connecting
- corrected
- could
- data
- Dollar
- downside
- downward
- Drop
- Even
- Eyes
- facing
- follow
- For
- formed
- fresh
- fresh increase
- from
- Gains
- High
- HOURS
- However
- HTTPS
- in
- Increase
- indicates
- internal
- IT
- Kraken
- lead
- Level
- levels
- Line
- losing
- losses
- Low
- Lumen
- MACD
- major
- might
- Momentum
- more
- move
- moving
- moving average
- Near
- next
- of
- on
- overall
- plato
- Plato Data Intelligence
- PlatoData
- positive
- Post
- price
- Price Analysis
- Resistance
- retracement
- Rise
- rsi
- similar
- Simple
- spike
- start
- started
- stay
- Stellar
- Stellar Lumen
- such
- support
- support level
- support levels
- Swing
- TAG
- that
- The
- to
- toward
- Trading
- TradingView
- Trend
- Upside
- upward
- us
- US Dollar
- USD
- via
- with
- XLM
- XLM/USD
- zephyrnet